Introduction
With the completion of KUDU-3691, Apache Kudu now offers full Prometheus metrics support - making it straightforward to integrate Kudu monitoring into Grafana. This guide covers the basics, from installing Prometheus and Grafana to configuring them. It provides a practical approach to crafting Grafana dashboards for a better understanding of Apache Kudu.
Full Prometheus metrics support is available on the master branch and will ship with the upcoming Kudu 1.19 release.
Integration Benefits
The built-in Kudu web server exposes metrics as a point-in-time snapshot per daemon. Prometheus adds historical retention, cross-node aggregation, and alerting - Grafana provides the visualization layer on top. Together they allow correlating Kudu metrics with the rest of the infrastructure in a single place.
Prerequisites
Ensure that you have the following:
- A running Apache Kudu cluster: At least one master and one tablet server. See the Kudu quickstart guide if you need to set one up.
- Prometheus: Follow the official Prometheus installation guide to set up Prometheus on your system.
- Grafana (optional): Install Grafana by following the official Grafana documentation if you want to visualize the collected metrics.
Prometheus Configuration for Kudu
- Open the Prometheus configuration file, typically located at /etc/prometheus/prometheus.yml. If using a custom location, specify it accordingly.
- Add the following snippet to the file to configure Prometheus to scrape Kudu metrics:
global: scrape_interval: 15s evaluation_interval: 15s scrape_configs: - job_name: "kudu" metrics_path: "/metrics_prometheus" static_configs: - targets: ["master-1:8051", "master-2:8051", "master-3:8051"] group: "masters" - targets: ["tserver-1:8050", "tserver-2:8050", "tserver-3:8050"] group: "tservers" - Adjust the targets to match the Kudu instances in your environment. For more configuration options, refer to the Prometheus documentation.
- Start Prometheus, if using a custom config location, use the config.file command line flag, for
example:
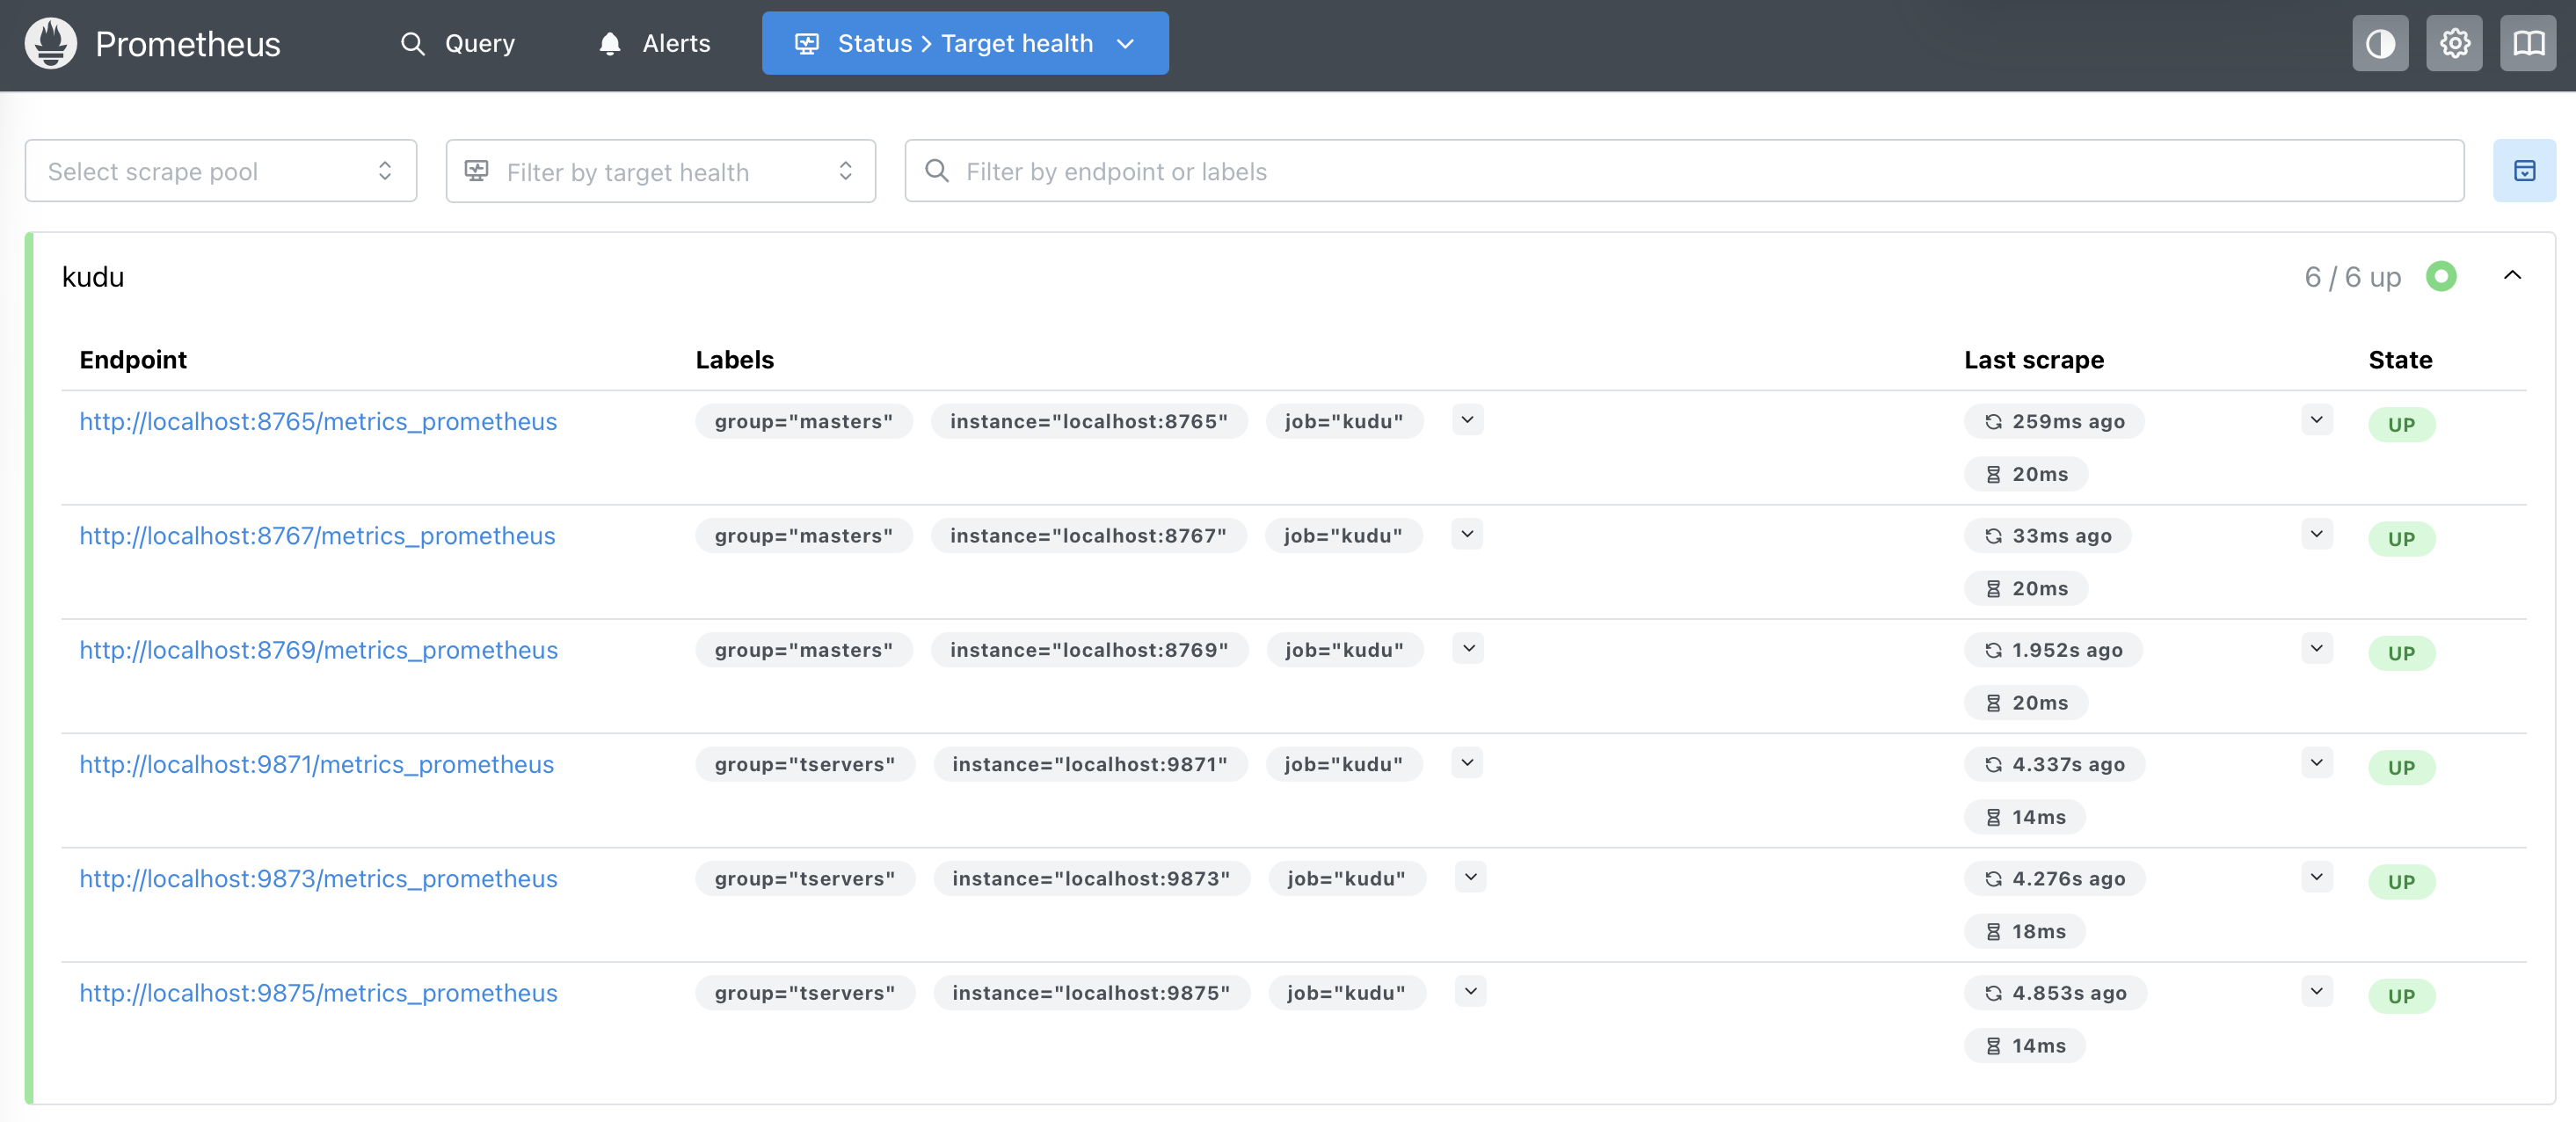
$ prometheus --config.file="<custom_path>/prometheus.yml" - Verify that Prometheus is running on localhost:9090 and check the /targets endpoint to ensure all Kudu services are up.
Grafana Setup
- Start Grafana, which runs by default on port 3000.
- Configure Prometheus as a data source in Grafana:
- Follow the steps outlined in the Grafana documentation to add Prometheus as a data source.
- Set the Prometheus URL to the Prometheus server (e.g., http://localhost:9090).
- Save and test the connection.
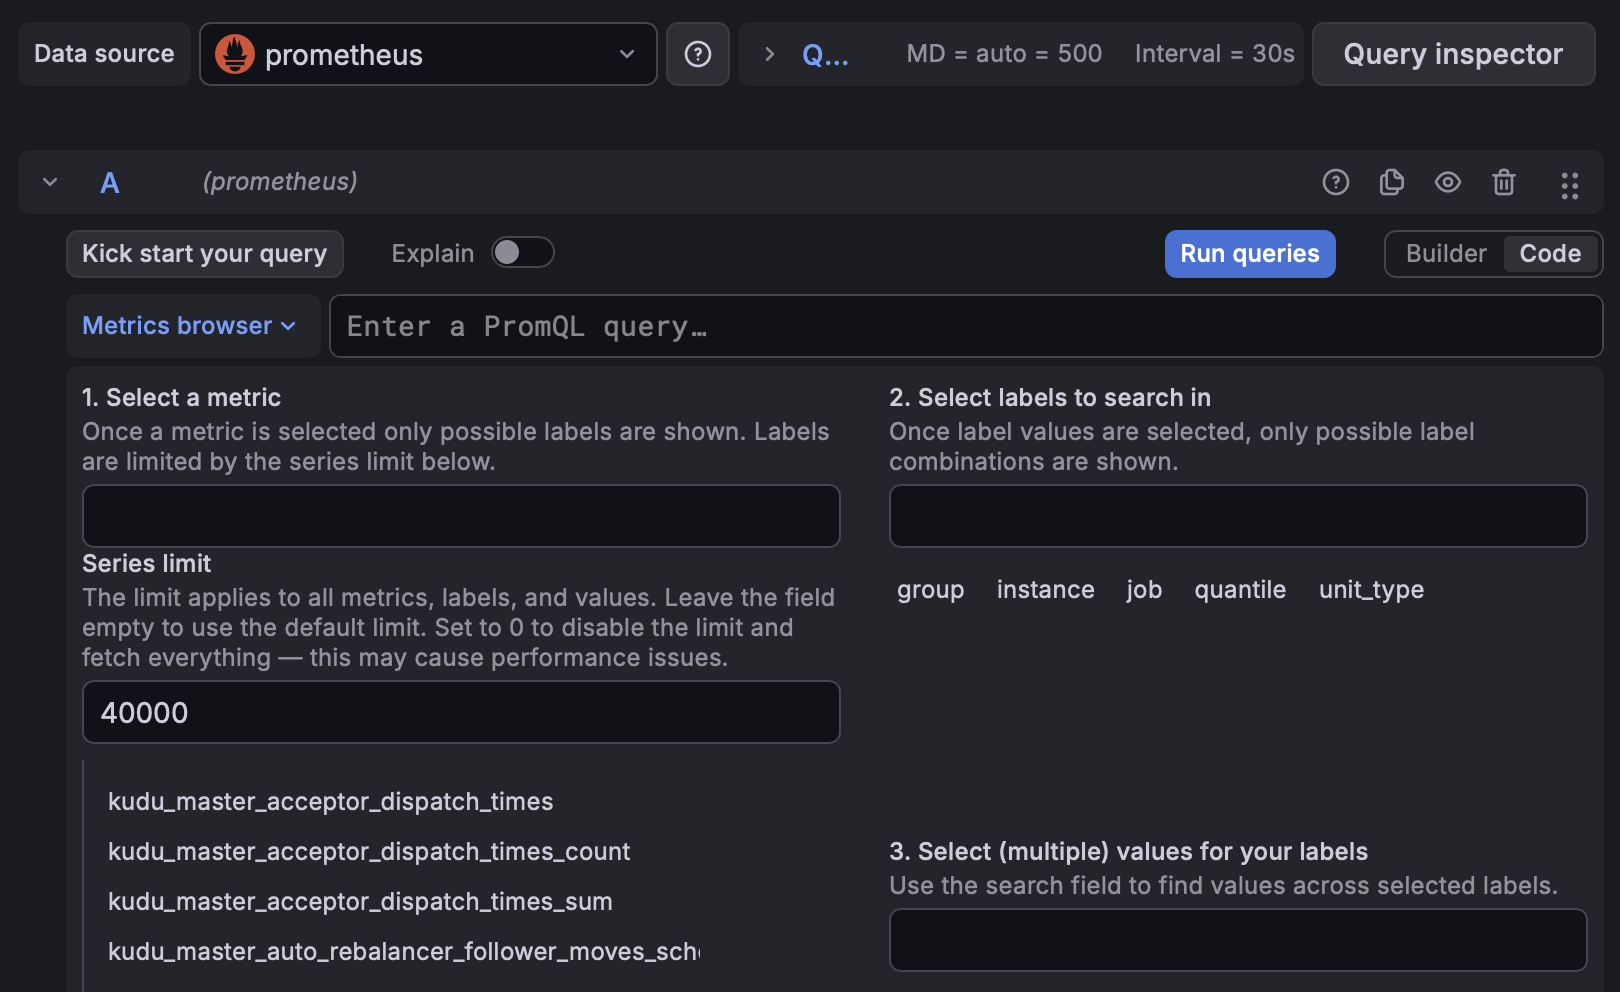
- For a comprehensive list of available metrics in Kudu, please refer to the official metrics reference. Kudu Prometheus metrics all have the “kudu_” prefix.
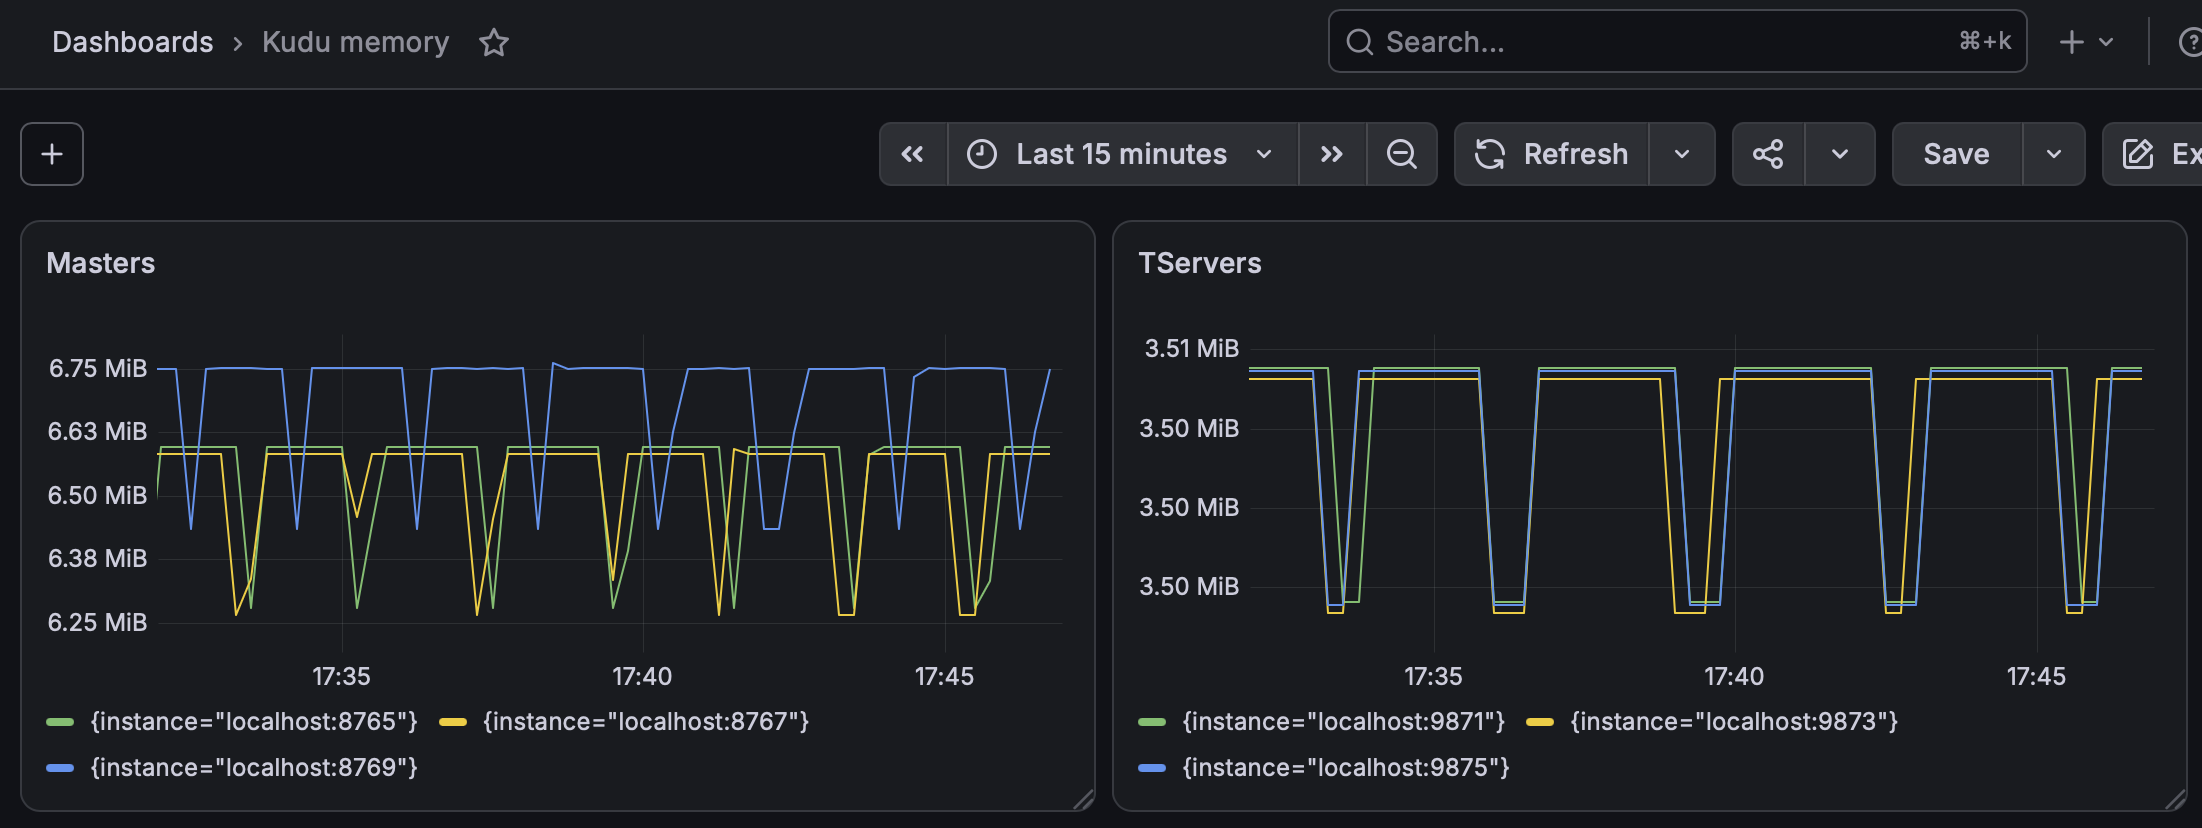
- Create a Kudu Dashboard:
- Navigate to the “+” menu on the left sidebar and select “Dashboard”.
- Add a new panel, select Prometheus as the data source, and use PromQL
queries to create visualizations based on Kudu metrics.
Working with a large number of TServers
For clusters with many tablet servers, manually listing every target in prometheus.yml is
impractical and breaks when nodes are added or removed. Kudu masters expose an HTTP service
discovery endpoint at /prometheus-sd that Prometheus can poll directly, returning all registered
masters and tablet servers automatically.
The endpoint:
- Is served only by the leader master (non-leaders return an empty response with HTTP 200)
- Returns one target per server with labels:
group(masters/tservers),cluster_id,location, and__scheme__(http/https) - Automatically excludes presumed-dead tablet servers
- Supports authentication via the
--webserver_prometheus_token_cmdflag
Example Prometheus config using http_sd_configs:
global:
  scrape_interval: 15s
  evaluation_interval: 15s

scrape_configs:
  - job_name: "kudu"
    metrics_path: "/metrics_prometheus"
    http_sd_configs:
      - url: "http://master-1:8051/prometheus-sd"
      - url: "http://master-2:8051/prometheus-sd"
      - url: "http://master-3:8051/prometheus-sd"
By pointing at all masters, Prometheus discovers all targets regardless of which master is currently the leader. Non-leader masters return an empty list, so there is no duplication.
A sample response from the endpoint:
[
    {
        "targets": [
            "master-1:8051"
        ],
        "labels": {
            "group": "masters",
            "cluster_id": "fb61f15b7f184f009731f52a1b973bfa",
            "location": "n/a",
            "__scheme__": "http"
        }
    },
    {
        "targets": [
            "tserver-1:8050"
        ],
        "labels": {
            "group": "tservers",
            "cluster_id": "fb61f15b7f184f009731f52a1b973bfa",
            "location": "n/a",
            "__scheme__": "http"
        }
    },
    ...
]
For more details on HTTP service discovery configuration options, refer to the Prometheus documentation.
Capability Notes
Tablet-level metrics are available at the /metrics_prometheus endpoint since
Kudu 1.18. The --metrics_prometheus_use_entity_labels flag controls how they
are represented in the output:
false(default): Entity IDs are embedded in metric names (e.g.kudu_tablet_<tablet_id>_on_disk_data_size). This preserves backward compatibility with existing dashboards and alerting rules but prevents label-based aggregation in PromQL.true(recommended for new deployments): Entity attributes appear as Prometheus labels on a shared metric name, enabling queries likesum by (table_name)(kudu_on_disk_data_size).